confidence intervals

The Unbelievably Easy Way To Calculate Confidence Intervals

We often say, “I’m fairly certain that this will happen,” or “I’m quite confident about this,” in most spheres of life. We’ve all discussed this at one point or another. Everyone will be able to see from our words that we always have some level of certainty and trust in them. If we can assign a number to this naturally occurring but rather ambiguous phrase, it will make more sense.

Let’s assume that we have a record of how often a remark like this has been made. As soon as we begin, we enter the statistical realm by entering a number. We may now define the degree of certainty using a number in the field of statistics. This number may fall within a certain range. The confidence interval may be thought of as the range to which the number belongs.

A confidence interval, in technical terms, represents the level of data uncertainty. These are often used to illustrate how much trust one may put in the outcomes indicated in poll or survey findings. Because of how they are by definition, confidence intervals and confidence levels are related.

What does a confidence interval really mean?

Simply said, as we saw in the example above, confidence intervals are based on an average score plus or minus some sampling error. In other words, it gives you a general range to base your estimate on.

What is the aim of creating confidence intervals?

  • Studies using random sampling gain dependability through confidence intervals.
  • If the research is repeated, it shows how reliable your estimate is. A minimal divergence from the initial estimate is preferred.
  • The variability in your data may also be represented via confidence intervals, which are generally effective.
  • Additionally, confidence intervals aid in identifying mean changes between many samples.

For instance,

  • For a client, an advertising firm launches two distinct campaigns in ten shops each.
  • They figure out the typical sales from each campaign
  • Then they make confidence intervals to gauge the variance in outcomes.

Create a free survey to see how confidence intervals works

Confidence interval calculation terms

1. Initial Sample Size

The quantity of objects or people included in a study sample is known as the sample size. This sample will be representative of the study’s intended audience.

Consider the scenario where we wish to forecast the reactions of clients in California and Singapore to a product rebranding. If so, we can try it out on samples of clients from these nations initially. The number of respondents from each nation in this scenario will serve as the sample size.

As long as it doesn’t exceed 1,000, 10% of the population serves as a decent maximum sample size.

2. Observed Score and True Score

For instance, you could be interested in seeing what proportion of customers in your whole target market are able to successfully make an order on an e-commerce website.

You will have thousands of users, unless your audience is incredibly tiny, and it would be hard to calculate that figure exactly because you would need to ask every single member of your audience to make an order on your website and track whether they were successful.

The genuine score, which cannot be precisely calculated, is the value of the measure based on the complete population. It is nonetheless conceivable to evaluate it.

This is what the sample size is used for. The study’s conclusion then provides us with an observed score, which we utilize to calculate the real score.

3. Percentile of the sample

We already have a sample size. What, then, is the purpose of this sample proportion?

Well, sampling is an investigation of a certain quality, isn’t it? A sample proportion is the percentage of respondents who successfully display that attribute, to put it simply.

The optimum sample percentage depends on the objectives of your study.

Consider the situation where you need to know how many products on a manufacturing line are faulty. The ratio should ideally be as low as feasible since, else, it won’t seem good for your business! In contrast, you want a large number of respondents in a hardware store survey to make a purchase before departing.

4. Confidence Level

When describing your degree of confidence that your survey’s sample size accurately reflects the population size, you use the phrase “confidence level.”

The level of confidence is always expressed as a percentage. For instance, if you repeat a poll with a 90% confidence level, the findings will 90% of the time match the real results from a bigger population.

To put it another way, your data is accurate!

5. Error Margin

Your survey findings’ margin of error represents the degree of sampling error. One should have less faith that the observed score accurately represents the real score of the population, the higher the margin of error.

For instance, if you evaluate customer experience, let’s say that an average of all your customers’ satisfaction ratings would result in an 8 out of 10. We clearly can’t poll every single one of your consumers, but let’s pretend we did.

Would you be okay with receiving a 7.5 on your survey on client satisfaction? Or maybe 8.5? Although it wouldn’t be exact, it would be within striking distance.

Your margin of error in the aforementioned example is around 0.5, or 5% when represented as a percentage. In most cases, a margin of error of 4% to 8% is acceptable and still produces useful findings.

Four steps to calculate confidence intervals

This method of calculating a confidence interval requires the following:

  • N stands for samples.
  • P = Sample’s Percentage
  • Confidence Level (CL)
  • Margin of Error (MoE)
  • Observed Score: The mean, or outcome

1. Calculate the sample percentage (p)

Divide the sample size by the number of successful items (X) to get the sample percentage (P) (N).

P = X/N

2. Assess Your Confidence Level

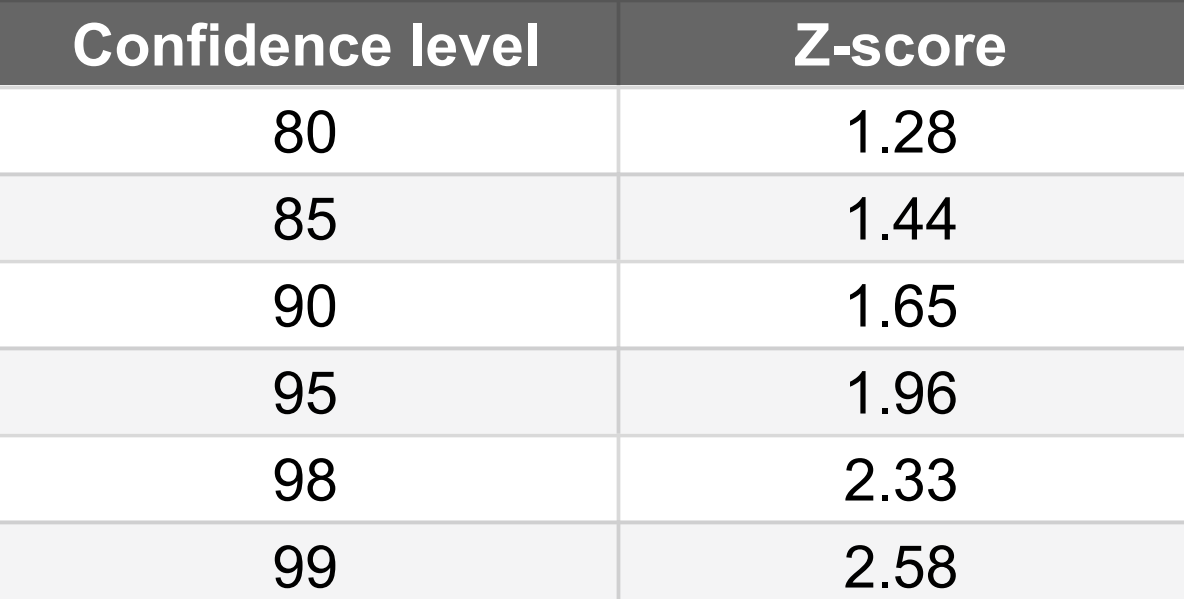
Choose one of the 5 confidence levels listed below. There is a score assigned to each level.

3. Determine the margin of error in step three

You now know your sample size, sample percentage, and degree of confidence.

It’s time to figure out the error margin. Enter the figures in our MOE calculator.

4. Estimate the confidence interval

When you include the margin of error and the observed score, you can quickly determine the confidence intervals.

Using these steps, calculate confidence interval and conduct a survey NOW!

Confidence interval illustration

Let’s say we want to know which drink is more popular at the nearest Starbucks.

Over the course of a month, we took a random sample of 5,000 customers at Starbucks. Our sample size is thus:

N = 5,000

We discovered that 1,276 people from this sample ordered a Pumpkin Spice Latte based on the order data. Our sample percentage will be as follows:

P = 1,276/5,000 = 0.255

We selected a confidence interval of 95% because we are relatively certain that the sample order data accurately represents the whole population of Starbucks consumers.

It’s time to figure out the error margin. The calculator receives the numbers, and results are produced.

Our error margin is +/-1%.

Conclusion

Confidence intervals are sometimes interpreted as indicating that the genuine score falls within the range. A confidence interval merely describes the range of data we may anticipate receiving if we repeat the same investigation in the same manner.

Therefore, it is important to consider your sample and research methodologies in order to get an observed score that is similar to the real score. Furthermore, a confidence interval is a measure. It is not intended to provide any interpretations or insights into the target demographic.

FAQs

1. What is the z value for 95%?

When utilising a 95 percent confidence level, the essential z-score values are between -1.96 and +1.96 standard deviations.

2. What is the z-score of the 92% confidence interval?

Z-score of the 92% confidence interval is 1.7.

For backlinks and collaborations, please mail at maria@fynzo.com.

Fynzo Online Survey Creator