

What’s the point of SPSS software?
There are many different kinds of software that can be used to analyze data. But when it comes to being easy to use and flexible, SPSS is hard to beat. This software is great for both business and academic research because it has a lot of features, is easy to use, and can do powerful statistical analysis.
The Most Important Function of SPSS
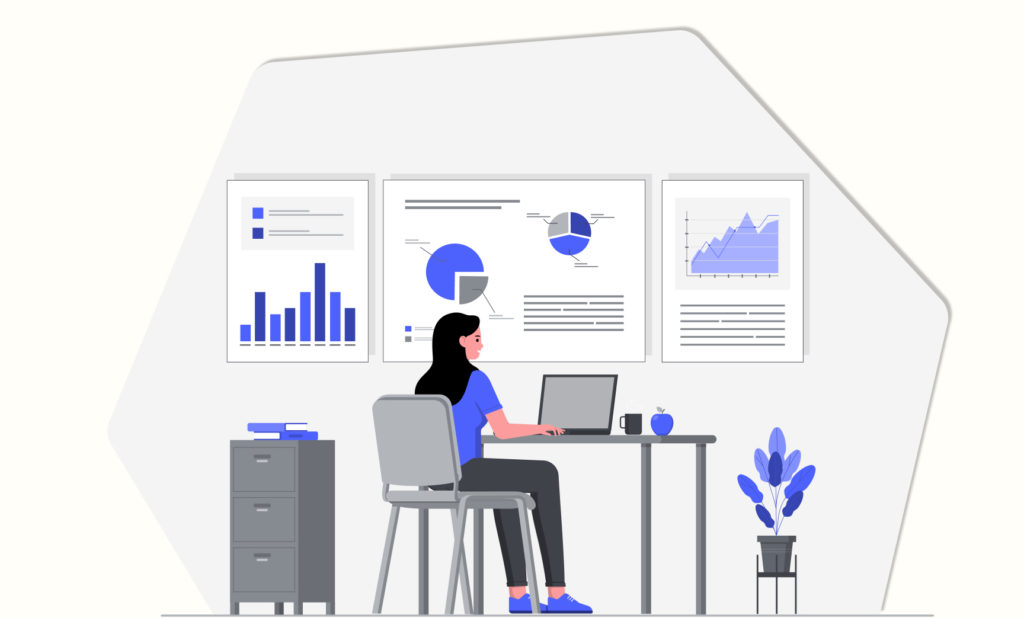
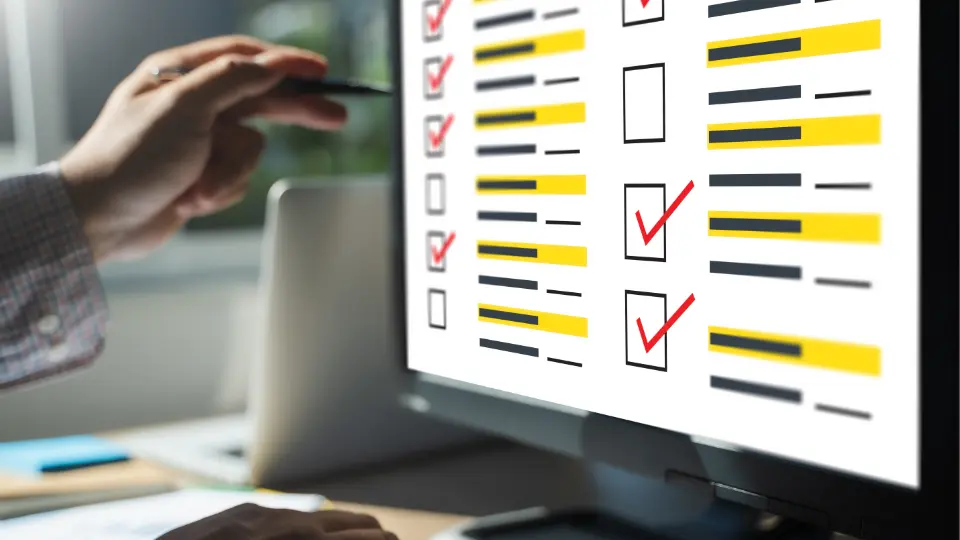
If you do research or work in business, this software is one of the most important tools you can have. This tool for statistical analysis and data management is used to do a lot of different things, like entering data, doing regression analysis, and making visual displays. It can also be used for market research, survey research, and other things.
1. The Program for Text Analytics
Text analytics is a field of study that looks at text data by using machine learning algorithms. This information can be used to improve marketing campaigns, make better business decisions, or help with customer service. Text analytics can also be used to run polls and collect information.
2. Modeler Program
The modeler program is one of the most important tools for analyzing data. It lets you make and run models that predict what will happen, measure risk, or look into trends. You can use different models, like linear regression, logistic regression, and so on. Since you have many options, the sky’s the limit when it comes to the insights and predictions you can make!
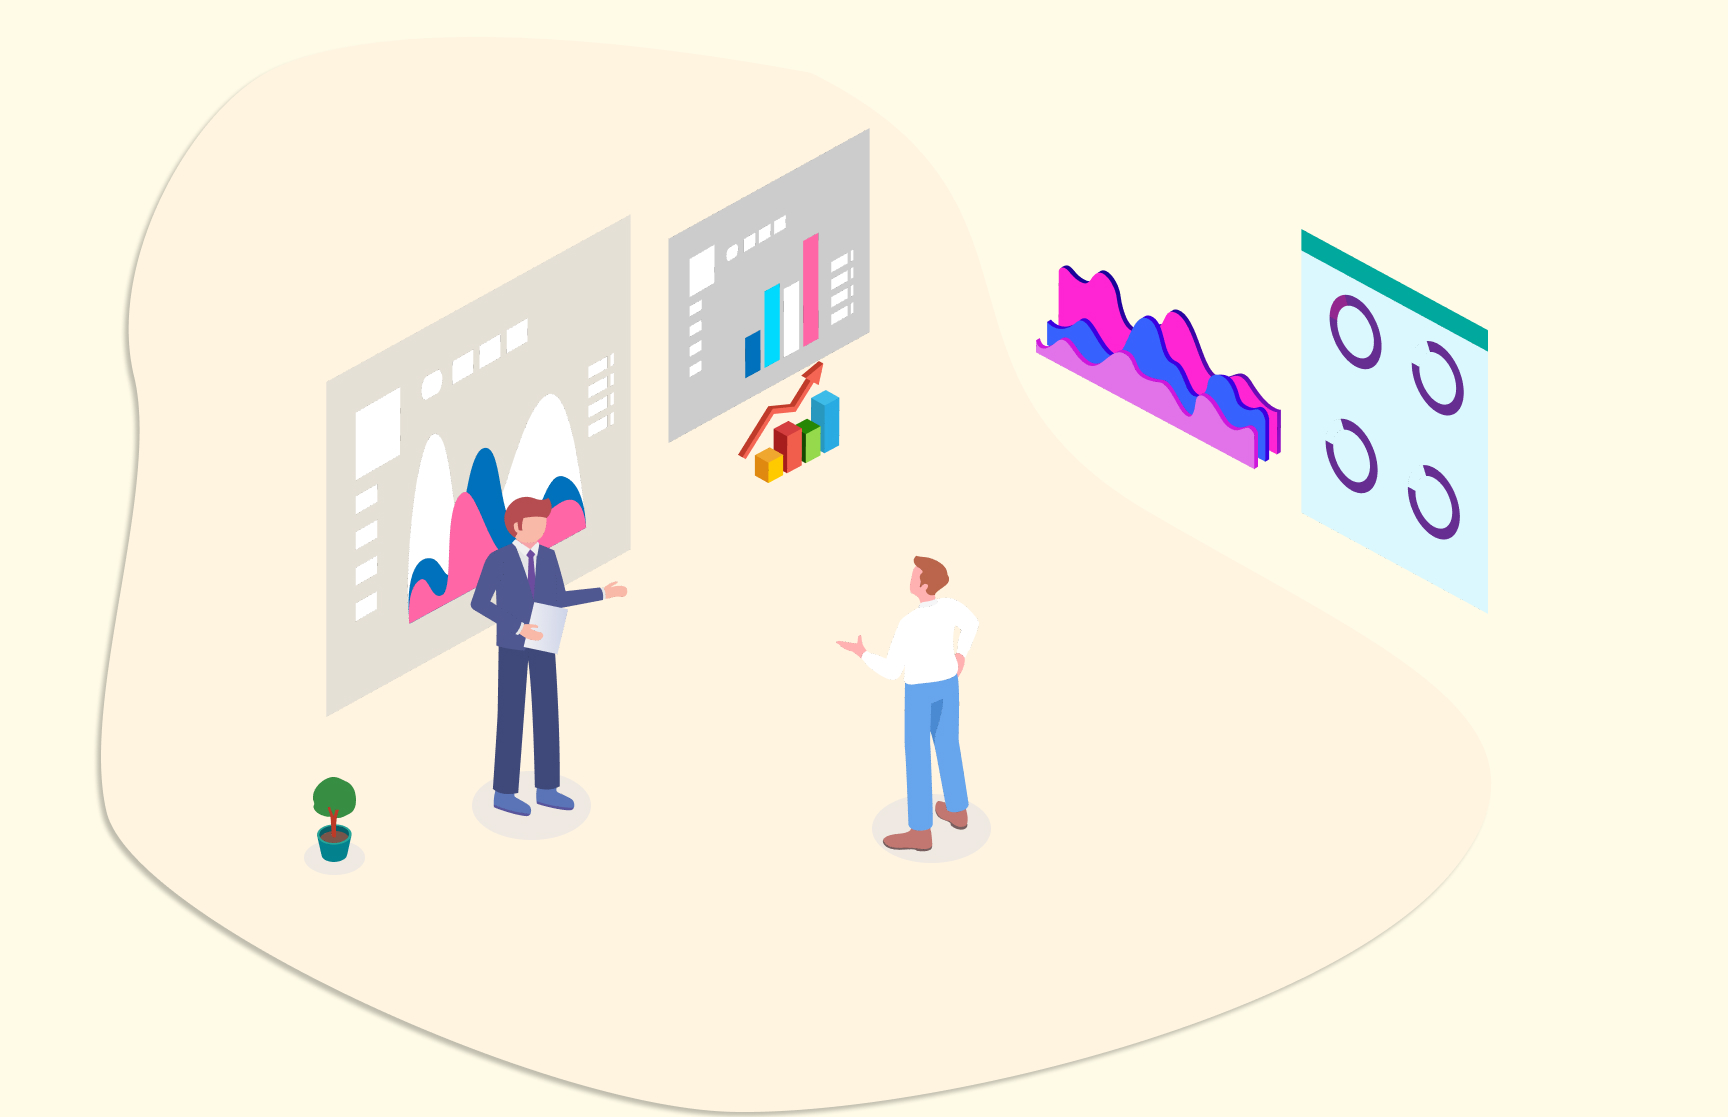
3. Visualization Designer
The Visualization Designer is one of its most important features, and it can be used to create graphs, tables, bar charts, and line graphs.
By using the Visualization Designer, you can easily see how your data is related to each other and how it changes over time. This makes it easy to understand your data and to find out which The most important parts are that you can also use this tool to create hypotheses about how your data affects your business or the world around you.
Overall, the Visualization Designer is an essential tool for anyone who wants to make sense of their data. It can help you understand trends and patterns, spot problems early on, and make informed decisions about what actions to take next.
4. Program for Statistics
SPSS is a program that allows users to perform statistical analysis on data. It includes a wide variety of functions, including the following:
- Regression analysis
- Clustering and classification
- Multivariate analysis
- Basic descriptive statistics
- Measures of central tendency and variability
- Interaction test
Use Cases for SPSS by Industry
SPSS is a popular piece of statistical software that has been used in a wide range of fields. It gives researchers a number of statistical analysis procedures (SAPs) that can help them look at data in a useful way.
This software can be used for many things in business, education, health care, and the social sciences, such as data analysis, data mining, research, and data presentation. It can also be used to analyze data in survey research and marketing research.
1. Medical care
Healthcare is very important in the world we live in now. SPSS software helps researchers figure out how different treatments affect patients, shows how effective marketing campaigns are, etc., and, most importantly, helps improve patient care by finding patterns and trends in data.
SPSS software is a powerful data analysis tool used in health care. It lets users do statistical analyses using descriptive statistics, regression analysis, factor analysis, etc., which can help them better understand how social factors affect health outcomes.
2. Schooling
SPSS can be used to teach important things like statistics and data analysis. Researchers, statisticians, educational institutions, marketing professionals, and a lot of other people use this software.
3. Retail
One of the most exciting and fast-moving industries in the world today is retail. With SPSS, you can analyze data and make business decisions that will help your store or retailer grow in a way that is sustainable.
For example, you can figure out where you need to make changes by analyzing survey data to measure customer satisfaction and loyalty programs. Also, if you know how your customers act, you can create better marketing campaigns that connect with them on an emotional level.
So, this software has everything you need, whether you’re a small business owner just starting out or a big player looking for new ways to improve your operations.
4. Market Analysis
One of the most common uses for SPSS is market research. It can be used to collect data on a variety of different topics, including customer sentiment, product trends, and competitor activity. It can also be used to determine which products or services are selling well and why.
Conclusion
SPSS is a powerful statistical analysis software package that is used by business professionals, researchers, and statisticians all over the world. In this blog, we’ve talked about the basics of this software so that you know everything there is to know about it. Check out our website for more useful information about how to use this software to improve your ability to analyze data. Conduct your own survey here and apply statistical analysis using SPSS software.